Quick start
First things first
import phlab
Now let’s create our workspace, which is a wrapper for all the experiments and models:
workspace = phlab.rixs()
One of the main objects is a model. You can create any number of models and fit them to the experiment.
Here were are starting with a single harmonic oscillator model. Check ./model_name/ for input and output files.
model = workspace.model_single_osc(name = '1d')
creating model : /Users/lusigeondzian/github/phlab/examples/01_example/1d
/Users/lusigeondzian/github/phlab/examples/01_example/1d/_input/
no input found
creating new input
warning : please check new input
number of models : 1
Input by default is reading from ./model_name/_inputs/input_model_{nm}.json and is an attribute of the model
model.input
{'problem_type': 'rixs',
 'model': '1d',
 'method': 'fc',
 'vib_space': 1,
 'coupling': 0.1,
 'omega_ph': 0.195,
 'nf': 10.0,
 'nm': 100.0,
 'energy_ex': 10.0,
 'omega_in': 10.0,
 'gamma': 0.105,
 'gamma_ph': 0.05,
 'alpha_exp': 0.01}
If you wish to alter the input inside your code, call the parameter you want to overwrite. (Note: when you will execute the model model.run() the input file will be overwritten)
model.input['coupling'] = 0.15
model.color = 'r'
model.run()
If you want to add an experiment, you have to specify the path to file with experimental data.
exp = workspace.experiment(file = 'test_data.csv', name= ' test')
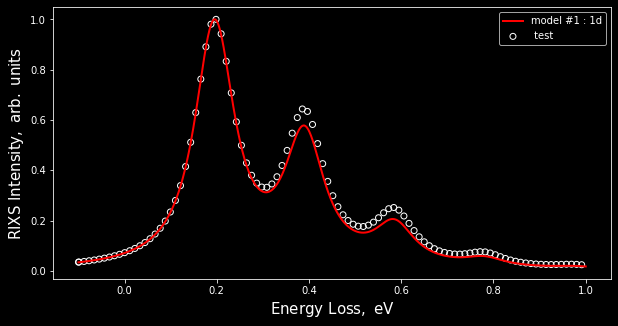
To visualize everything you can create vitem and list all models and experiment objects that you would like to compare. Feel free to use matplotlib library’s methods to customize resulting figure.
vitem = workspace.visual(model_list = [model], exp = exp)
Note: scale = 0 would normalizes everything by the maximum of intensity.
vitem.show(scale = 0)